Global stocks suffered a steep selloff to start the month with the MSCI All Country World Index’s (ACWI) losing as much as 7.73% on August 5th before recovering to finish “an August to remember” at its all-time high, gaining 2.54% for the month bringing YTD returns to 15.97%. The losses earlier in the month were tied to hedge funds unwinding a long-time “carry trade” on a cheap Japanese yen rather than fundamental threats to the economy. Investors stepped in to buy the dip on the seeming notion that another crisis or recession was not on the horizon, as encouraging economic data was released. Cooling inflation numbers also reassured investors. The US PCE (personal consumption expenditures) Price index, the Federal Reserve’s preferred inflation gauge, rose 0.2% in July and 2.5% from a year ago and was in line with estimates. Overseas, Eurozone inflation fell to a three-year low in August at 2.2% YoY, increasing expectations for the European Central Bank to cut rates in September. In addition, Canada’s annual inflation rate cooled to 2.5%, keeping a forecasted September interest rate cut on track.
Click the image to view the chart larger.
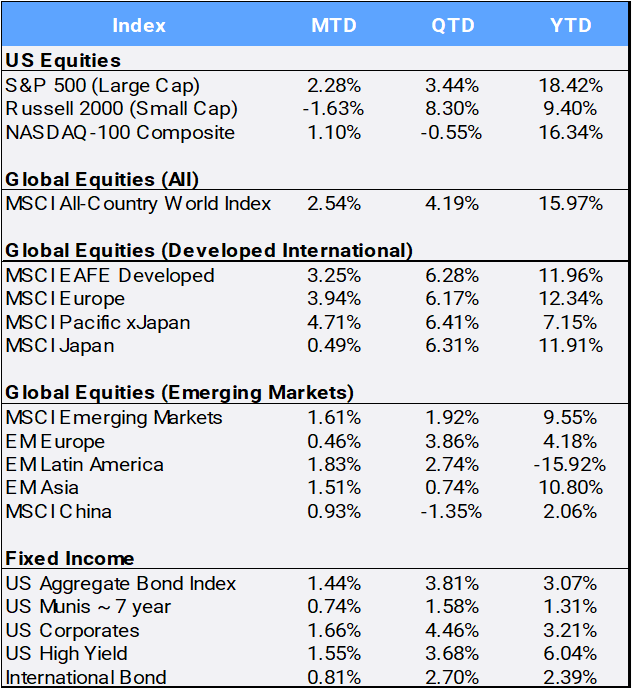
Source: Bloomberg Pricing Data, as of August 31, 2024
Japanese stocks dropped 12% on August 5th as the famed “carry trade” unwound and spooked global markets in Monday’s session. The CBOE S&P Volatility Index (VIX) spiked to an intraday high of 65.73 before closing August at a relative benign 15.00, down 8.31% overall on the month. It was the highest mark of the “fear index” since the Covid-19 pandemic. The MSCI Japan index was off over 20% at one point (its biggest drop since 1987), but by the time August was over, it was able to squeak out a 0.49% MTD gain.
US Q2 GDP was revised up to 3% from 2.8%, boosted by healthy consumer spending. In his Jackson Hole keynote, Federal Reserve Chair Powell remarked, “the time has come for policy to adjust”, the most direct signal yet that the FOMC intends to start cutting rates soon. US Treasury yields eased across the curve, and its inversion has flattened as the 2- and 10-year rates closed August at 3.92% and 3.90% after starting the year at 4.25% and 3.88% respectively.
As yields and prices have an inverted relationship, the US Aggregate bond index gained 1.44% MTD and is up 3.07% on the year. Global markets have been buoyed by increased optimism of a soft landing for the US economy and expectations for the start of interest rate cuts from the Federal Reserve in September, with follow-up cuts from the European Central Bank and others. However, the Bank of Japan made its first interest rate increase in decades, which was blamed for upending the global Yen “carry trade” that tends to support US dollar denominated assets. The US dollar depreciated 2.26% in August, yet the greenback remains up 1.10% YTD against a diversified basket of currencies.
Overseas, the pan-European Stoxx 600 made its all-time high, closing above 525 for the first time, having shaken off the sharp sell-off at the start of August. France’s preliminary, EU-harmonized consumer price index came in at 2.2% for August on an annual basis, down from the 2.7% print of July. Italy, Spain, and Germany also released CPI reports indicating inflation is easing.
Developed markets (EAFE) outperformed emerging markets (EM) in August, returning 3.25% and 1.61%, respectively. Chinese stocks gained 0.93% MTD but were the laggards. Reuters reported that Chinese state-owned banks were seen purchasing US
dollars to prevent the Chinese yuan from appreciating too fast, making local exports more expensive in foreign markets. China has also been hindered by issues in its property sector, deflation and regulatory pressures on tech companies.
In the US, the Dow Jones Industrial Average ended a volatile month on a high note, as it posted a fresh record high of 41,563.08 to close the month up 1.76%, bringing its YTD return to 10.28%. Intramonth, the tech heavy Nasdaq index entered correction territory (declining over 10%), but rallied to finish the month with a 1.10% gain to bring its YTD return to 16.34%. Value stocks outperformed their Growth style peers 2.23% to 1.86% MTD and pulled ahead 7.66% versus 0.54% QTD, but on the year, they still lag 13.05% to 20.11%, respectively. Nine of the eleven sectors gained in August, led by consumer staples (6.01%) and real estate (5.79%) with energy (-2.13%) and consumer discretionary (-0.18%) being the laggards.
Energy stocks were adversely affected by falling crude oil prices that declined 5.60% in August. Meanwhile, Gold gained 2.28% MTD and reached an all-time high of $2,531.60 on August 20th. The safe haven asset is up 21.35% YTD. Yet bitcoin, often referred to as “digital gold”, declined 8.54% in August, but still remains up an impressive 40.80% YTD.
The US Democratic National Convention was held in Chicago August 19-22 and officially nominated Vice President Kamala Harris as its candidate for president and Governor Tim Walz of Minnesota for vice president. They will oppose the Republican party nominees of former president Donald Trump for president and Senator JD Vance from Ohio for vice president for the Nov. 5, 2024, election. Many billionaires are fuming about Harris’s proposed ‘unrealized’ capital gains proposal which suggests the ultra-wealthy pay a 25% minimum tax.
Disclosure Statement
Perigon Wealth Management, LLC (‘Perigon’) is an independent investment adviser registered under the Investment Advisers Act of 1940. Information in this message is for the intended recipient[s] only. Different types of investments involve varying degrees of risk. Therefore, it should not be assumed that future performance of any specific investment or investment strategy will be profitable. Please click here for important disclosures or visit our website at perigonwealth.com.
More information about the firm can be found in its Form ADV Part 2, which is available upon request by calling 877-977-2555 or by emailing compliance@perigonwealth.com
Performance
Past performance is not an indicator of future results. Additionally, because we do not render legal or tax advice, this report should not be regarded as such. The value of your investments and the income derived from them can go down as well as up. This does not constitute an offer to buy or sell and cannot be relied on as a representation that any transaction necessarily could have been or can be affected at the stated price.
The material contained in this document is for information purposes only. Perigon does not warrant the accuracy of the information provided herein for any particular purpose.
Additional Information regarding our investment strategies, and the underlying calculations of our composites is available upon request.
Data Source: Bloomberg Pricing Data, as of August 31, 2024.