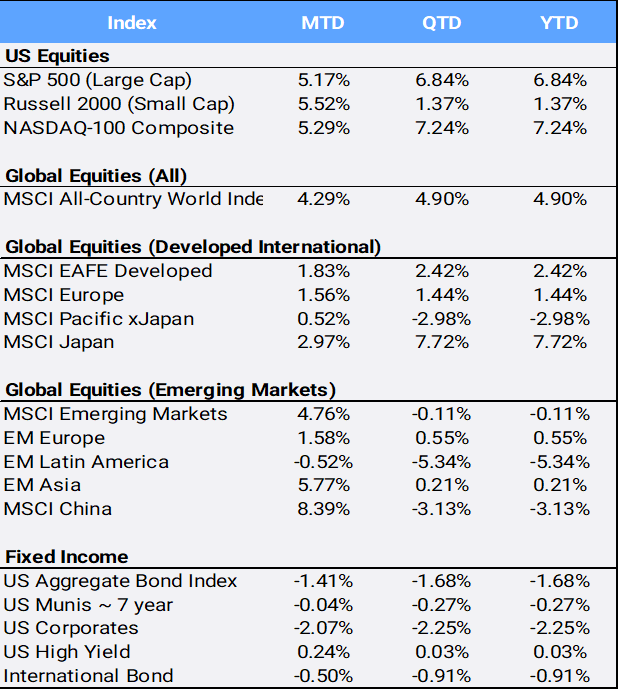
Global stocks soared 4.29% in February to bring 2024 returns to 4.90% YTD. The MSCI All Country World Index closed the month at an all-time high. In the US, the large cap S&P 500 index also popped 5.17% in February to a record close, with gains in 16 of the last 18 weeks – a feat that hasn’t happened since 1971. All eleven sectors were positive for the month, led by Consumer Discretionary (+7.96% MTD), Industrials (+7.23% MTD) and Materials (+6.52%). So far in 2024, nine of eleven sectors are up YTD led by Communications (+9.39% YTD) with only Utilities (-1.93%) and Real Estate (-2.28%) in the red. The second-best performing sector YTD is Technology (7.64%) which helped the tech-heavy Nasdaq composite finish the month at its first closing record since November 2021. Chipmaker Nvidia is the third largest company in the world by market capitalization and was the largest positive contributor to stock market returns both for the month (+25.58% ) and YTD (+59.76%) after its blockbuster earnings report on February 21st.
Click the image to view the chart larger.
Source: Bloomberg Pricing Data, as of February 29, 2024
US economic data showed that Q4 GDP was revised only slightly lower, from 3.3% to 3.2% — not enough to worry investors, as the CBOE S&P Volatility Index (VIX), often referred to as “the fear index,” dropped 6.62% from January to 13.40. The Personal Consumption Expenditures (PCE) index, the US Federal Reserve’s preferred measure of inflation, continues to trend favorably, increased just 0.4% in January from the prior month and 2.8% YoY – the latter annual figure at its lowest level in three years. Still, Treasury yields inched higher as the US 2-year and 10-year rate climbed to 4.62% and 4.38% respectively, after starting the year at 4.25% and 4.21%, and the yield curve continues to be inverted. Historians note that an inverted yield curve has historically predicted US recessions with greater accuracy than many other economic indicators. However, despite the curve being inverted since summer 2022, the US economy continues to show robust growth. Because bond yields and prices move in opposite directions, the US Aggregate bond index slipped 1.41% in February to bring YTD returns to down 1.68%. Traders are pricing in a 66% probability the Fed will begin cutting rates in June.
The dollar index hit a three-month high against a diversified basket of international currencies; the US greenback has appreciated 2.79% so far in 2024. Overseas, Japan’s benchmark Nikkei 225 index finally rose above its all-time high, posted 34 years ago, and is up 17.04% in local currency returns for 2024. Bank of Japan board member Hajime Takata said he felt there were finally prospects for achieving the bank’s 2% inflation target, paving the way to leave behind negative rates and yield caps. Japan is the largest country holding in the developed market MSCI EAFE Index at more than 22% weighting.
In emerging markets, China led index returns with an 8.55% gain in February, after falling 10.63% in January. China announced the largest ever reduction in its benchmark mortgage rate, cutting the five-year loan prime rate by 25 basis points to 3.95% to support a struggling real estate market. Chinese manufacturing activity in February contracted for a fifth straight month, further pressuring policymakers to initiate more stimulus measures ahead of the annual National People’s Congress parliamentary meeting in early March.
The diversified Bloomberg Commodity index slipped -1.47% in February to drop YTD returns into the red at -1.08%. Crude oil gained 3.18% to $78.26/barrel ahead of OPEC’s anticipated decision in early March to extend production cuts. Metals, however, were mixed as gold inched 0.23% higher while silver fell -1.23%, bringing YTD returns down 0.91% and 4.71% respectively.
Bitcoin continued its recent surge, soaring 44.68% in February to close at 61,430 – reaching levels last seen during the late-2021 frenzy. The largest cryptocurrency is up 46.49% YTD.
Disclosure Statement
Perigon Wealth Management, LLC (‘Perigon’) is an independent investment adviser registered under the Investment Advisers Act of 1940. More information about the firm can be found in its Form ADV Part 2, which is available upon request by calling 415-430-4140 or by emailing compliance@perigonwealth.com
Performance
Past performance is not an indicator of future results. Additionally, because we do not render legal or tax advice, this report should not be regarded as such. The value of your investments and the income derived from them can go down as well as up. This does not constitute an offer to buy or sell and cannot be relied on as a representation that any transaction necessarily could have been or can be affected at the stated price.
The material contained in this document is for information purposes only. Perigon does not warrant the accuracy of the information provided herein for any particular purpose.
Additional Information regarding our investment strategies, and the underlying calculations of our composites is available upon request.
Data Source: Bloomberg Pricing Data, as of February 29, 2024.
Annual Form ADV
Every client may request a copy of our most current Form ADV Part II. This document serves as our “brochure” to our clients and contains information and disclosures as required by law.
Perigon Wealth Management, LLC is a registered investment advisor. Information in this message is for the intended recipient[s] only. Different types of investments involve varying degrees of risk. Therefore, it should not be assumed that future performance of any specific investment or investment strategy will be profitable. Please click here for important disclosures.”


