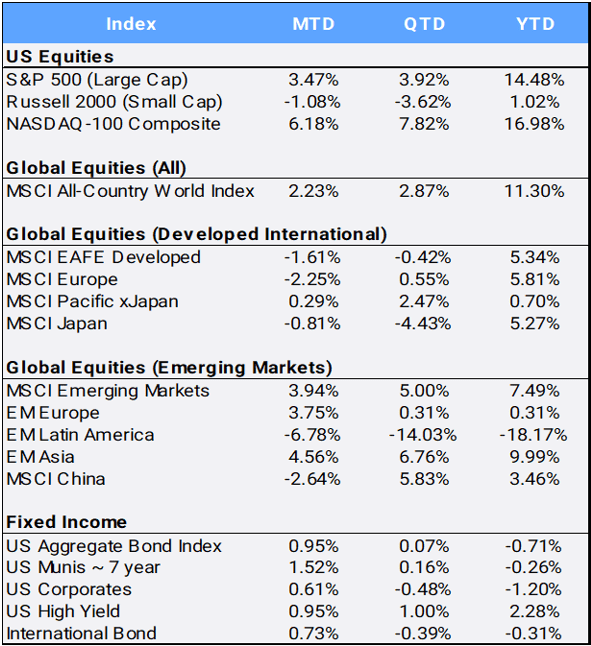
Global stocks continued their resiliency, gaining 2.23% in June and 2.87% in Q2, bringing the MSCI All Country World Index’s (ACWI) 2024 YTD return through June 30 to 11.30%. It is the sixth-best start to a year since the inception of the ACWI in 1998, although it trails 2023’s first-half return of 13.93%. The index posted four new closing highs this month to bring its YTD total to 32. U.S. equities were the largest contributor to global returns, as the broad S&P 500 index jumped 14.48% in the first half, and the technology-heavy Nasdaq 100 climbed 16.98% thanks to the artificial intelligence craze capturing investor excitement and propelling the concentration in the overall market. The rally was indeed top-heavy, as the “average stock”, as measured by the equal-weight S&P 500 index (SPW), fell -0.65% in June and slipped -3.09% for the quarter to bring its YTD gain to just 3.94% so far in 2024. How top heavy? The ten largest stocks in the S&P 500 now comprise more than 30% of the index, which is the highest ratio in history, and they have contributed nearly 73% of the index’s YTD gain. In Q2, the S&P 500 was up 3.92%, with the top 10 stocks contributing 5.60%, meaning the stocks outside of the top 10 in aggregate were negative. Still, despite the narrow market rally, slowing inflation paired with better-than-expected consumer sentiment figures left the CBOE S&P Volatility Index (VIX), or “fear index”, nearly unchanged at 12.44.
Click the image to view the chart larger.
Source: Bloomberg Pricing Data, as of June 30, 2024
U.S. inflation in May slowed to its lowest annual rate in more than three years, as Core PCE, the U.S. Federal Reserve’s preferred inflation measure, rose just 0.1% in May and 2.6% from the prior year – not far from the Fed’s 2% target. Inflation statistics have been considered paramount by traders as they try to gauge when the Federal Reserve will begin cutting interest rates, and markets are now pricing in the chance of just two quarter-percentage-point rate cuts this year, with the first likely to come in September. Still, the yield curve has been inverted for more than two years, and the 2-year and 10-year rates closed the first half at 4.75% and 4.40% after starting the year at 4.25% and 3.88%, respectively.
The U.S. Aggregate and International bond indexes crept higher this quarter but remain in negative territory for the year at -0.71% and -0.31% respectively. With the Fed’s delay in loosening its key rate, the U.S. dollar has appreciated 1.14% in June, 1.32% in the second quarter and 4.47% YTD against a basket of diversified currencies.
Overseas, the Japanese yen fell to its lowest level since 1986, prompting authorities to signal readiness to intervene in the foreign exchange market. With two separate June inflation readings accelerating, there is hope that the Bank of Japan may be able to raise interest rates at the end of July, which in turn could support their flagging currency. Still, with a depreciating currency, exports become cheaper overseas, and Japan’s broad-based Topix stock index hit its highest level since 1990. With improving corporate governance standards, Japanese stocks have been the third highest contributor to global stock returns in 2024, behind the U.S. and MSCI Taiwan — with the latter up 35.91% YTD fueled by stocks along the AI value chain. Heavyweight Taiwan SemiConductor Manufacturing climbed 63% in the first half of the year, while its rival Foxconn jumped 105% in the same period. Netherlands, the home of international AI darling ASML, is the second-best developed market performer YTD, up 20.06%.
On the other side of the international returns coin is ACWI’s largest detractors from index results: Brazil, Hong Kong, and Mexico, falling 18.70%, 12.97%, and 16.95% YTD, respectively. Brazilian markets were roiled by data on the country’s budget deficit, fueling concerns about President Luiz Inacio Lula da Silva’s commitment to shoring up its fiscal accounts. In developed markets, France was another detractor from global markets, off 3.93% YTD after French President Macron dissolved the country’s parliament and called a snap election after his party was trounced in earlier European elections.
In addition, with geopolitical tensions increasing even further in the Ukraine War and ongoing conflicts in the Middle East, traditional “safe haven” gold slipped -0.02% in July, but still has gained 4.34% in Q2 and is up 12.79% YTD. Oil prices are rising as signs point toward an open war between Israel and Hezbollah, stoking fears of a confrontation with OPEC member Iran. Crude gained 5.91% in June to bring its YTD return to 13.80%. Meanwhile, bitcoin fell -11.11% in June and dropped -13.69% in Q2, yet remains up 43.36% on the year.
Lastly, ten of the 11 sectors posted gains so far this year, led by Communications (up 18.58%) and Technology (up 18.01%), with only Real Estate being in the red at -2.45% YTD. The housing market continues to show signs of stress due to high prices and mortgage rates.
Disclosure Statement
Perigon Wealth Management, LLC (‘Perigon’) is an independent investment adviser registered under the Investment Advisers Act of 1940. More information about the firm can be found in its Form ADV Part 2, which is available upon request by calling 415-430-4140 or by emailing compliance@perigonwealth.com
Performance
Past performance is not an indicator of future results. Additionally, because we do not render legal or tax advice, this report should not be regarded as such. The value of your investments and the income derived from them can go down as well as up. This does not constitute an offer to buy or sell and cannot be relied on as a representation that any transaction necessarily could have been or can be affected at the stated price.
The material contained in this document is for information purposes only. Perigon does not warrant the accuracy of the information provided herein for any particular purpose.
Additional Information regarding our investment strategies, and the underlying calculations of our composites is available upon request.
Data Source: Bloomberg Pricing Data, as of June 30, 2024.
Annual Form ADV
Every client may request a copy of our most current Form ADV Part II. This document serves as our “brochure” to our clients and contains information and disclosures as required by law.
Perigon Wealth Management, LLC is a registered investment advisor. Information in this message is for the intended recipient[s] only. Different types of investments involve varying degrees of risk. Therefore, it should not be assumed that future performance of any specific investment or investment strategy will be profitable. Please click here for important disclosures.”