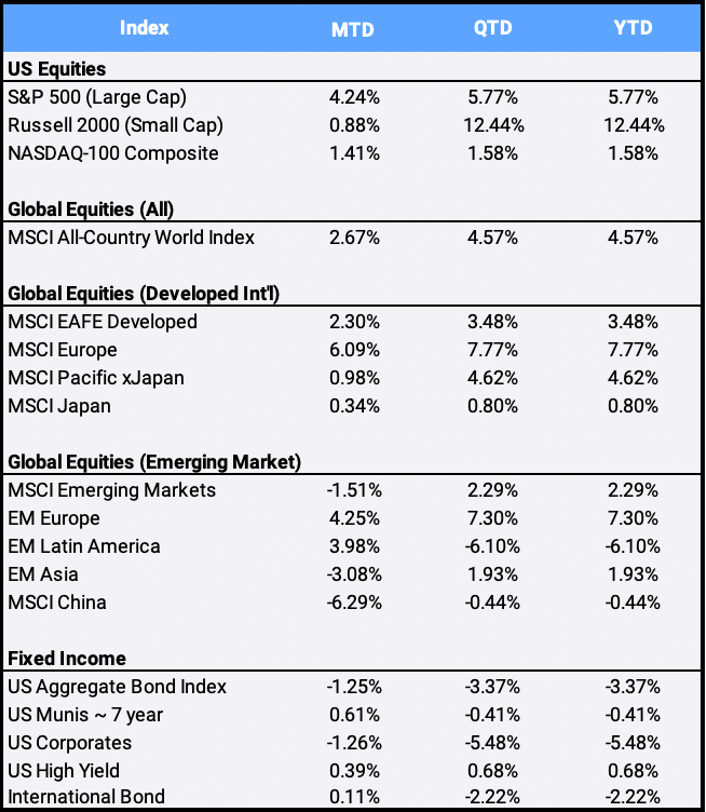
The S&P 500 closed the first quarter at a record high, climbing 4.42% in March. That brought YTD returns to 5.77%, ahead of President Joe Biden’s unveiling of a $2.25 trillion infrastructure and stimulus spending program after the trading close on March 31st. The White House outlined a plan to raise corporate taxes to 28%, combined with measures designed to stop offshoring of profits, to fund the infrastructure plan within 15 years. Globally, the MSCI All-Country World Index (ACWI) gained 2.67% in March to post its fourth straight quarterly gain, returning 4.57% in Q1 of 2021.
Click the image to view the chart larger.
Source: Bloomberg Pricing Data, as of March 31, 2021
Meanwhile, the latest stimulus program heated inflation fears and spooked the bond markets. The S&P U.S. Aggregate Bond Index plunged 1.25% in March and 3.37% in the first quarter to mark the flagship fixed income index’s worst quarterly return since September 1981. Despite Fed chairman Jerome Powell stating the Fed Open Market Committee’s belief that inflationary pressures would only be transitory, the yield on the 10-year treasury rose to 1.74%.
The Dow Jones Industrials and Nasdaq 100 indexes gained 6.62% and 1.41% respectively in March to bring their Q1 returns to 7.76% and 1.58%. The Dow’s outperformance over the tech-heavy Nasdaq indicated a rotation trade, the first time the Dow beat the technology-heavy Nasdaq on a quarterly basis since 2018. Tech stocks are especially sensitive to rising interest rates because they often depend on borrowing money cheaply to invest in their future growth. The jump in interest rates also forced many investors to reconsider paying such high prices for many stocks, particularly the tech giants that were big winners earlier in the pandemic.
The Russell 2000 small cap index gained 0.88% in March to bring its Q1 return to an impressive 12.44%, outperforming its large cap peers over that span. A strengthening economy due to the increasing rollout of COVID-19 vaccinations and massive spending by the US government is expected to boost profits for many domestic companies in the year ahead. A sector rotation appears underway, as the two worst performing sectors in 2020 led this first quarter. Last year energy and financials fell 1.69% and 32.84%, respectively; in Q1 they were up 30.70% and 15.99%.
In commodities, oil soared 21.93% while silver and gold silver plunged 7.52% and 10.04% respectively – marking gold’s worst Q1 return since 1982. In what is sometimes billed as “the digital gold”, bitcoin traded at an all-time high of 61,078 on March 13th and gained more than 29% this month to bring its Q1 return to 103.37%. This follows the world’s largest cryptocurrency’s skyrocketing 305.07% growth in 2020.
Overseas, developed markets climbed 2.30% higher this month to bring the MSCI EAFE index to a 3.48% Q1 return. However, emerging markets slipped 1.51% in March. China, the largest constituent country in the region, was also the index’s biggest loser, falling 6.29% this month and ending in the red YTD, slipping 0.44% in Q1. Internet stocks make up more than 42% of the MSCI China index, and its two largest holdings, Tencent and Alibaba, fell 4.64% and 8.14% in March on fears that more Chinese companies may be de-listed from U.S. stock exchanges after the 2020 passage of the Holding Foreign Companies Accountable Act requiring companies to state they are not owned or controlled by foreign governments.
Disclosure Statement
Perigon Wealth Management, LLC (‘Perigon’) is an independent investment adviser registered under the Investment Advisers Act of 1940.
Performance
Past performance is not an indicator of future results. Additionally, because we do not render legal or tax advice, this report should not be regarded as such. The value of your investments and the income derived from them can go down as well as up. This does not constitute an offer to buy or sell and cannot be relied on as a representation that any transaction necessarily could have been or can be affected at the stated price.
The material contained in this document is for information purposes only. Perigon does not warrant the accuracy of the information provided herein for any particular purpose.
Additional Information regarding our investment strategies, and the underlying calculations of our composites is available upon request.
Data Source: Bloomberg Pricing Data, as of March 31, 2021.
Annual Form ADV
Every client may request a copy of our most current Form ADV Part II. This document serves as our “brochure” to our clients and contains information and disclosures as required by law.
Perigon Wealth Management, LLC is a registered investment advisor. Information in this message is for the intended recipient[s] only. Different types of investments involve varying degrees of risk. Therefore, it should not be assumed that future performance of any specific investment or investment strategy will be profitable. Please click here for important disclosures.”


