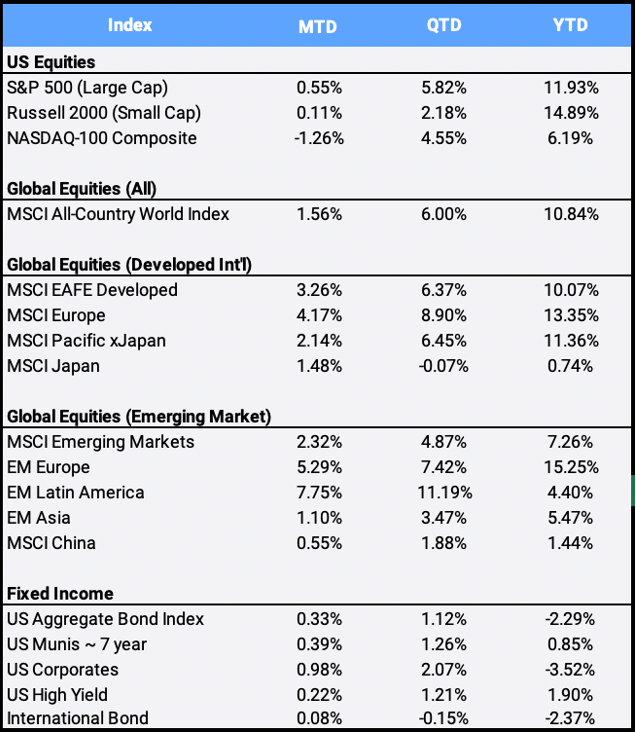
Global Equities finished May 2021 at an all-time high, as the MSCI ACWI (All Country World Index) gained 1.56% this month to bring YTD returns to 10.84%. In the US, the rapidly expanding economy continued to gain steam, yet markets traded mixed in the wake of more evidence of growing inflation. Both the Dow Jones and the S&P 500 were able to tie together their fourth-straight month of gains, returning 1.93% and 0.55% respectively in May, while the technology-heavy Nasdaq slipped -1.26%.
Click the image to view the chart larger.
Source: Bloomberg Pricing Data, as of May 31, 2021
The CBOE/S&P Volatility Index (“the VIX”), a gauge of stress in markets, spiked to 27.59 on May 12th but eased -9.94% to finish May at 16.76. Turbulence in risky assets was partially sparked by a huge selloff in cryptocurrencies. China banned its financial institutions from providing services related to the digital transactions. In addition, Elon Musk tweeted an update that Tesla has suspended vehicle purchases using Bitcoin over concerns about the “rapidly increasing use of fossil fuels” for mining. Bitcoin fell -35.42% MTD, yet remains in the positive for 2021 with its 26.54% YTD return.
Inflation continues to run hot, as the Federal Reserve’s preferred measure of inflation, the US Personal Consumption Expenditure (PCE) Price Index, increased 3.1% in April. While a recap of the Fed meeting minutes mentioned that a strong pickup in economic activity may justify discussions about tightening monetary policy, chair Jerome Powell reiterated his view that the recovery remains “uneven and far from complete” and has not yet progressed enough progress for policy change.
Powell’s reassurances helped sooth treasury yields, as the 10-year Treasury benchmark interest rate finished May at 1.589%, down from 1.625% the month prior. As yields and bond prices move in opposite directions, the US Aggregate Bond Index tacked on a 0.33% gain in May to its 0.79% April return in a slow recovery from Q1, when the benchmark plunged -3.37% for its worst quarterly return since September 1981.
Energy, materials and financials were the best-performing sectors in May, gaining 5.80%, 5.11% and 4.79% respectively. The first two were boosted by rising prices, as oil gained 4.31% while gold, silver, and copper climbed 7.79%, 8.14% and 4.69% respectively. Financials benefited from a steepening global yield curve as rates climb in longer duration yields.
The Russell 2000 Index squeaked by with a 0.11% MTD return, enough to mark its eighth straight monthly gain and its longest such winning streak since 1995. The so-called “Meme” stocks have been in focus lately, with shares of AMC Entertainment and GameStop Corp surging more than 160% and 27% respectively in May. Social media speculations continued to drive interest in the shares of companies that represent the 7th and 3rd largest names in the small cap index – which has returned 14.89% so far in 2021.
The MSCI EAFE Index, which is dominated by companies from Europe and Japan, gained 3.26% in May despite slowing economic growth in Q1: Japan’s GDP contracted by -5.1% in Q1 after 6 months of double-digit growth, while in the Eurozone, Q1 GDP slipped by -0.6%. However, the developed markets index benefitted from the recent surge in global financial stocks, which make up more than 17% of the index, as well as a weakening US Dollar. The US greenback depreciated -1.59% this month to bring its depreciation to -3.65% YTD against an international basket of currencies.
Emerging markets rallied 2.32% in May to bring YTD returns to 7.26%. However, EM continues to lag its developed market peers despite a weaker US Dollar, rising commodity prices, and inflation concerns that typically buoy the asset class. As the largest country in the index at a weight of 37.79%, China continues to drag returns, up only 0.55% this month and just 1.44% on the year.
Disclosure Statement
Perigon Wealth Management, LLC (‘Perigon’) is an independent investment adviser registered under the Investment Advisers Act of 1940.
Performance
Past performance is not an indicator of future results. Additionally, because we do not render legal or tax advice, this report should not be regarded as such. The value of your investments and the income derived from them can go down as well as up. This does not constitute an offer to buy or sell and cannot be relied on as a representation that any transaction necessarily could have been or can be affected at the stated price.
The material contained in this document is for information purposes only. Perigon does not warrant the accuracy of the information provided herein for any particular purpose.
Additional Information regarding our investment strategies, and the underlying calculations of our composites is available upon request.
Data Source: Bloomberg Pricing Data, as of May 31, 2021.
Annual Form ADV
Every client may request a copy of our most current Form ADV Part II. This document serves as our “brochure” to our clients and contains information and disclosures as required by law.
Perigon Wealth Management, LLC is a registered investment advisor. Information in this message is for the intended recipient[s] only. Different types of investments involve varying degrees of risk. Therefore, it should not be assumed that future performance of any specific investment or investment strategy will be profitable. Please click here for important disclosures.”


