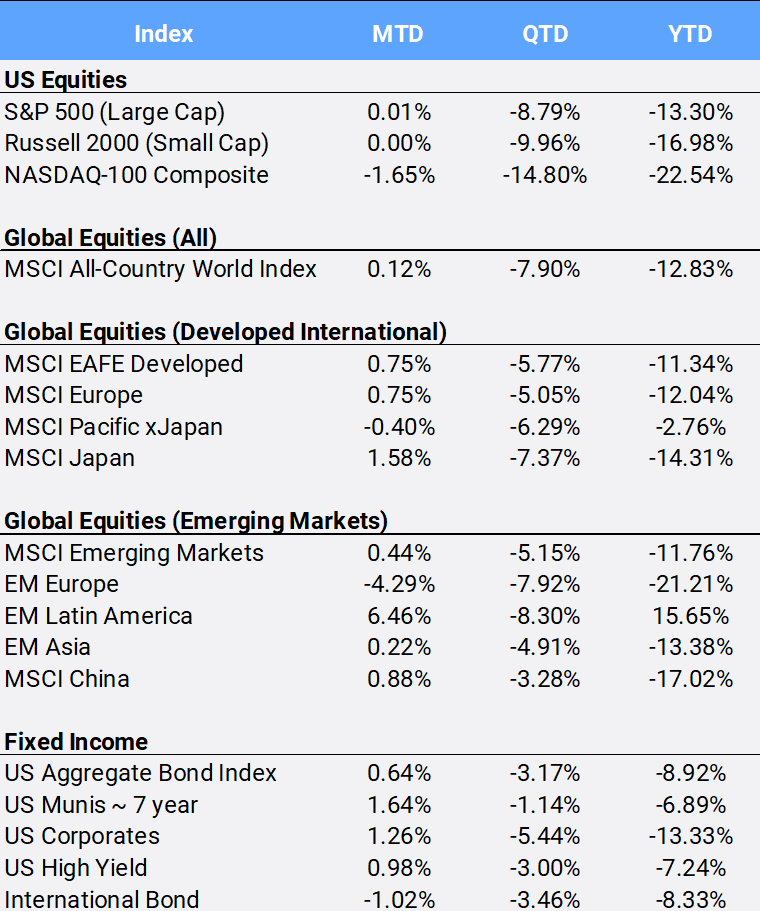
A turbulent month for markets ended almost where they started, as global equities eked out a 0.12% return in May. The MSCI All-Country World Index is down 12.83%YTD and is off to its worst five-month start since MSCI included its Emerging Markets category in 1998. In the US, the S&P 500 squeaked out a 0.01% gain in May but had to overcome three market drops of more than -3% and officially touched “bear market” territory (a drop of 20% from the highest point) on May 20th. The Dow Jones had to turn around its longest weekly losing streak since 1932, as it fell for eight consecutive weeks before rallying to finish May with a 0.04% return. YTD, the S&P 500 and Dow Jones are down -13.30% and -9.21% respectively. Many U.S. economic reports missed expectations, with high inflation, tightening financial conditions and recession fears all weighing down the global economic picture.
Click the image to view the chart larger.
Source: Bloomberg Pricing Data, as of May 31, 2022
The technology-heavy Nasdaq Index fell -1.65% in May following its -13.37% collapse in April that had been its worst monthly return since the 2008 financial crisis. Small cap stocks were unchanged this month. Both indexes are down -22.54% and -16.98% YTD. In global equities, MSCI ACWI Index heavyweights Microsoft and Apple – which are weighted 3.2% and 4.0% respectively – are dragging down the index with their -15.95% and -18.80% YTD returns. MSCI deleted Russia from the index in March.
Energy and Utilities were the best performing sectors this month, gaining 15.80% and 4.32% in May. They are also the best sectors so far in 2022, with YTD returns of 14.03% and -0.11% respectively. Consumer Discretionary has the worst May and YTD performance, slipping -5.17% in May and down -16.45% on the year. Amazon is the largest sector constituent and has the third-largest negative contribution to global returns as the online retailer is off -27.90% YTD.
At the start of May, the Federal Reserve raised interest rates by half a percentage point in a bid to tamp down inflation, even as concerns grow about possible economic contraction. The FOMC minutes from May reflected expectations for 50-basis point hikes at the next two meetings but also indicated potential flexibility as conditions develop. Eurozone inflation hit a record high for a seventh straight month, surging 8.1% in May. European Central Bank President Christine Lagarde indicated a potential end to the ECB’s era of negative interest rates by suggesting a possible a rate hike by July. It would be the ECB’s first increase in 11 years. U.S. bond markets were able to reverse their worst start to a year by returning 0.64% in May, with YTD returns at -8.92%. International bonds fell 1.02%in May and are down -8.33% on the year.
The U.S. dollar surged to a 20-year high on May 12th before reversing the trend later in the month, closing out May down -1.17% and ending four straight months of gains. YTD, the dollar has appreciated 6.36% against a basket of international currencies. Gold fell 3.14% in May to bring YTD returns to 0.45%. Higher short-term U.S. interest rates raise the opportunity cost of holding bullion, but gold is still seen by many as a safe haven during economic uncertainty. However, the Bloomberg Commodity index continues its climb, gaining 1.52% in May to bring YTD returns to 32.74%. This is its best yearly start since 1973, when it gained 72.03% in its first five months. Both oil and natural gas prices continue to skyrocket amidst geopolitical tensions, gaining 9.53% % and 12.44% in May to bring YTD returns to 52.47%% and 118.36% respectively. The European Union agreed to ban 90% of crude imports from Russia, and OPEC is weighing suspending Russia from its oil-production deal.
Tremors in the cryptocurrency markets added to overall market volatility, with Bitcoin plunging 17.56% in May after TerraUSD, one of the crypto stablecoins whose value is pegged to the U.S. dollar, collapsed earlier in in the month. Bitcoin has fallen -31.93% YTD.
Disclosure Statement
Perigon Wealth Management, LLC (‘Perigon’) is an independent investment adviser registered under the Investment Advisers Act of 1940. More information about the firm can be found in its Form ADV Part 2, which is available upon request by calling 415-430-4140 or by emailing compliance@perigonwealth.com
Performance
Past performance is not an indicator of future results. Additionally, because we do not render legal or tax advice, this report should not be regarded as such. The value of your investments and the income derived from them can go down as well as up. This does not constitute an offer to buy or sell and cannot be relied on as a representation that any transaction necessarily could have been or can be affected at the stated price.
The material contained in this document is for information purposes only. Perigon does not warrant the accuracy of the information provided herein for any particular purpose.
Additional Information regarding our investment strategies, and the underlying calculations of our composites is available upon request.
Data Source: Bloomberg Pricing Data, as of May 31, 2022.
Annual Form ADV
Every client may request a copy of our most current Form ADV Part II. This document serves as our “brochure” to our clients and contains information and disclosures as required by law.
Perigon Wealth Management, LLC is a registered investment advisor. Information in this message is for the intended recipient[s] only. Different types of investments involve varying degrees of risk. Therefore, it should not be assumed that future performance of any specific investment or investment strategy will be profitable. Please click here for important disclosures.”


